Debugging memory leaks in Xcode
Xcode memory graph
Ever got into a situation where you observed some strange behaviour with your app? Crashes, very bad performance or strange warnings in the console? Or simply you looked at the memory usage of your app and realised that it’s way too high for what your app should be doing?
Yeah! Most likely you are dealing with a memory leak.
Ugh, what is a memory leak exactly?
In a nutshell, a memory leak is when an object (or multiple objects) don’t get released from memory even after you remove all your references to it. At this point you (as the programmer) have no way to access this object or make use of it and still, it is in the memory occupying many precious bites on your device.
This is not only an issue because the memory is occupied but in many cases these leaked object can still react to event’s inside your app and produce unexpected outputs. For example if you have a manager that reacts to a certain system notification and updates the UI, you can end up having multiple instances of it all updating the UI against each other causing unintended and unexpected UI states.
How do you end up in such a situation? You may ask… Well, whilst there are multiple ways how you can cause a memory issue, the most common one (as long as you are working with Swift) is not knowing when to use your weak variables. But more on that later, first let’s see how to debug these issues
Let’s create some memory leaks
Create or open a project you will want to work in. In this article I’m going to be working with an iOS project, but the same principles apply to any of Apples platforms.
Start by adding two classes
class LeakingClass {
    var delegate: MyCoolDelegate?

    func addDelegate() {
        delegate = MyCoolDelegate(leaker: self)
    }
}

class MyCoolDelegate {
    var leaker: LeakingClass

    init(leaker: LeakingClass) {
        self.leaker = leaker
    }
}
I’ve named the second one a delegate because the delegate pattern is one of the more common places where people introduce memory leaks (Even though this is not exactly a delegate, but thats for an other article).
Next up, in your app entry point add this suspicious piece of code:
for _ in 0...4 {
     let leaker = LeakingClass()
     leaker.addDelegate()
}
I’ve added it to the init of my SwiftUI main App, but it doesn’t really matter where you place it as long as it runs on startup.
If that is done, there is nothing more left than running your app and.. nothing happens. Well, your tiny little classes hold no properties other than the references to each other and do nothing that could cause any issues to the user so it’s kind impossible to notice the leak at this point. But it is there, believe me.
Let’s catch the leak
Let’s pretend that you realised you have a leak but don’t know where. What are your options to catch it? Well, while there are multiple ways to do this, my favourite is using the memory graph. Let’s see how.
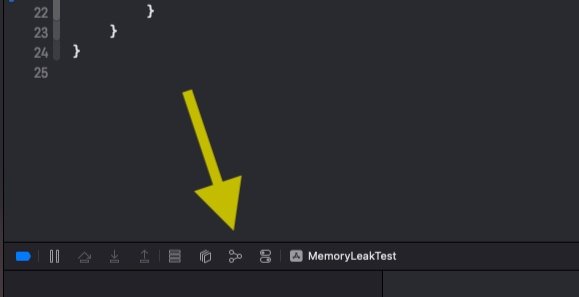
While your app is running, press the memory graph button on the bottom toolbar

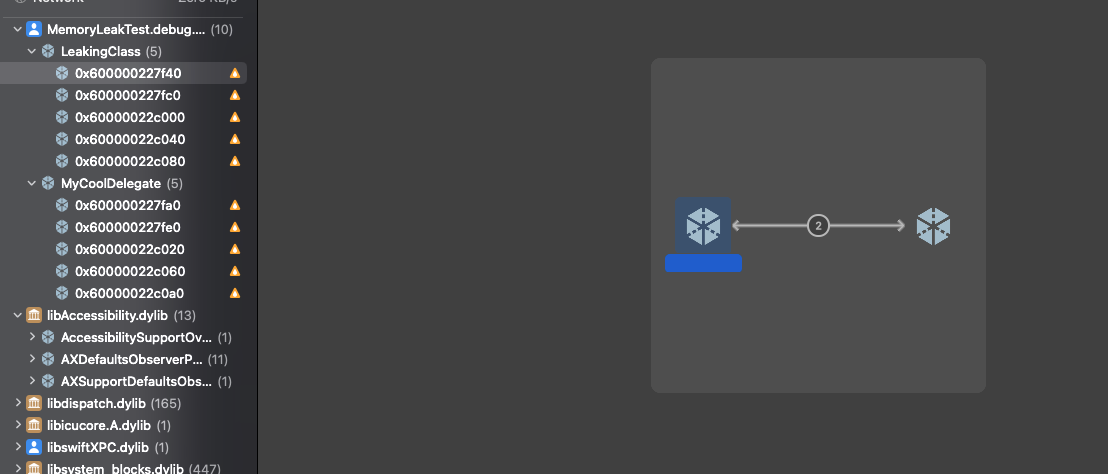
What this does is that Xcode will stop the execution of your app (just like a breakpoint) and generate a memory graph of all your instances showing you how they are related. If you look at the left side, you can probably already see the leaked objects
Of course it is not always that easy, Xcode will not always recognise a leak and mark it with a yellow mark. When debugging a real case scenario, look out for objects you suspect are leaking and objects that have way too many instances compared to what you expect

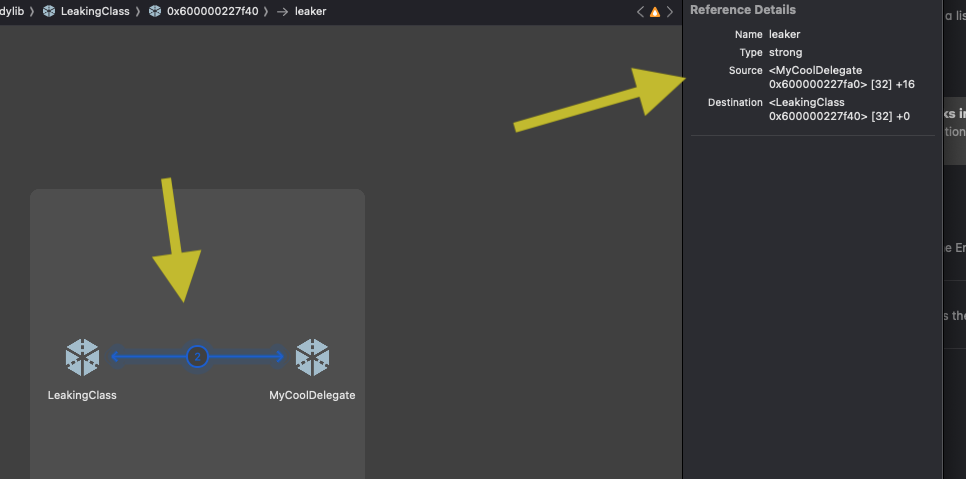
Okay, now you know that your LeakingClass is.. well leaking.. but why? If you look closer on the graph you can see that it shows that an instance of the LeakingClass is referencing an instance of the MyCoolDelegate and vice versa. If you click the arrow, you can also see what property holds the reference and wether it is a strong or a weak reference

And that my friend, is the key to your problem.
So what’s up with the weak references?
To understand this, let’s see how swift handles memory allocation and release in particular. The mechanism is called ARC which stands for automatic reference counting. All it does it it keeps track of all the references to an instance and as soon as the reference count hits 0, it releases the object. But there is a catch. As I’ve already hinted, there are strong and weak references and only a strong reference can retain an object. You can have as many weak references as you want, as soon as all strong references are gone so will your object be.
In our project, the issue is that both of our instances hold a strong reference to each other thus even when all instances from the context are gone, the instances can not be released. This is called a reference cycle
Finally, let’s solve this leak
Now, knowing the theory behind memory management, let’s see what we can do about our issue.
At this point, it should be clear that the solution is to make one of our references weak. But which one? This is more of an architecture question and way beyond the scope of this article but as a rule of thumb, in such a relationship, there is always a main and a secondary object. Usually you will want the secondary object to hold a weak reference to the main one, so the lifecycle of the main can be controlled by the environment it lives in without having to expose the existence of the secondary object.
In our case we will just pick one, let’s say we make the leaking property weak
class MyCoolDelegate {
    weak var leaker: LeakingClass!

    init(leaker: LeakingClass) {
        self.leaker = leaker
    }
}
If you rewrite your code like this then run your app again, you will see in the memory graph that there are no leaked instances any more
Conclusion
As I mentioned before, it is not always this simple to find the issue, but generally memory graph is the first tool I’m reaching for in such scenarios because it is the easiest to use while 99% of the time it provides me with answers pretty quickly.
At this point you can experiment further if you want, by storing a reference to some of those instances in your app, then releasing them based on some events (like a button click) and verifying the memory graph after each event.
I hope this article helped you sparing a few frustrating ours debugging your code, if yes, consider sharing it with your friends and coworkers. See you next time!
Related articles
Here are some more articles that may interest you. Check them out!
The TimelineView
published on November 2, 2025
SwiftUILearn how to use SwiftUI’s TimelineView to build time‑based animations. This article explains scheduler options, shows practical examples (pauseable clock, smooth minute‑progress ring with hue shifts and tick marks), and helps you choose the right schedule for smooth or precise updates.
Read moreFoundation Models
published on October 8, 2025
SwiftAILearn how to use Apple’s foundation models to run large language models locally on iOS. This article covers chat, streaming responses, structured data generation, and custom tools, helping you build secure and responsive AI features without relying on the cloud.
Read moreWorking with CoreBluetooth
published on September 30, 2025
SwiftiOSDiscover how to use CoreBluetooth in iOS to build apps that communicate with Bluetooth Low Energy devices. This article explains the roles of central and peripheral, how services and characteristics work, and provides a practical example for implementing both sides of BLE communication in Swift.
Read more